
Billing
Track Cursor token spend by user and model
Ingest Cursor Admin API usage into Costory. See chargeable token spend by user, model, Max mode, and SKU next to AWS and Anthropic. 12-month backfill, Terraform or UI, ~5 minutes.
Setup in 5 minutes

01 · BY USER
Chargeable Cursor usage by user email and model. Group by Resource name for per-developer spend, or by SKU for input vs output tokens. Costory finds the group-by that explains the spike.
02 · BY MODEL
See Cursor token spend next to AWS, GCP, and Anthropic. Correlate Max mode, Compose vs Chat, and headless runs with the metric that actually matters — DAU, deploys, usage.

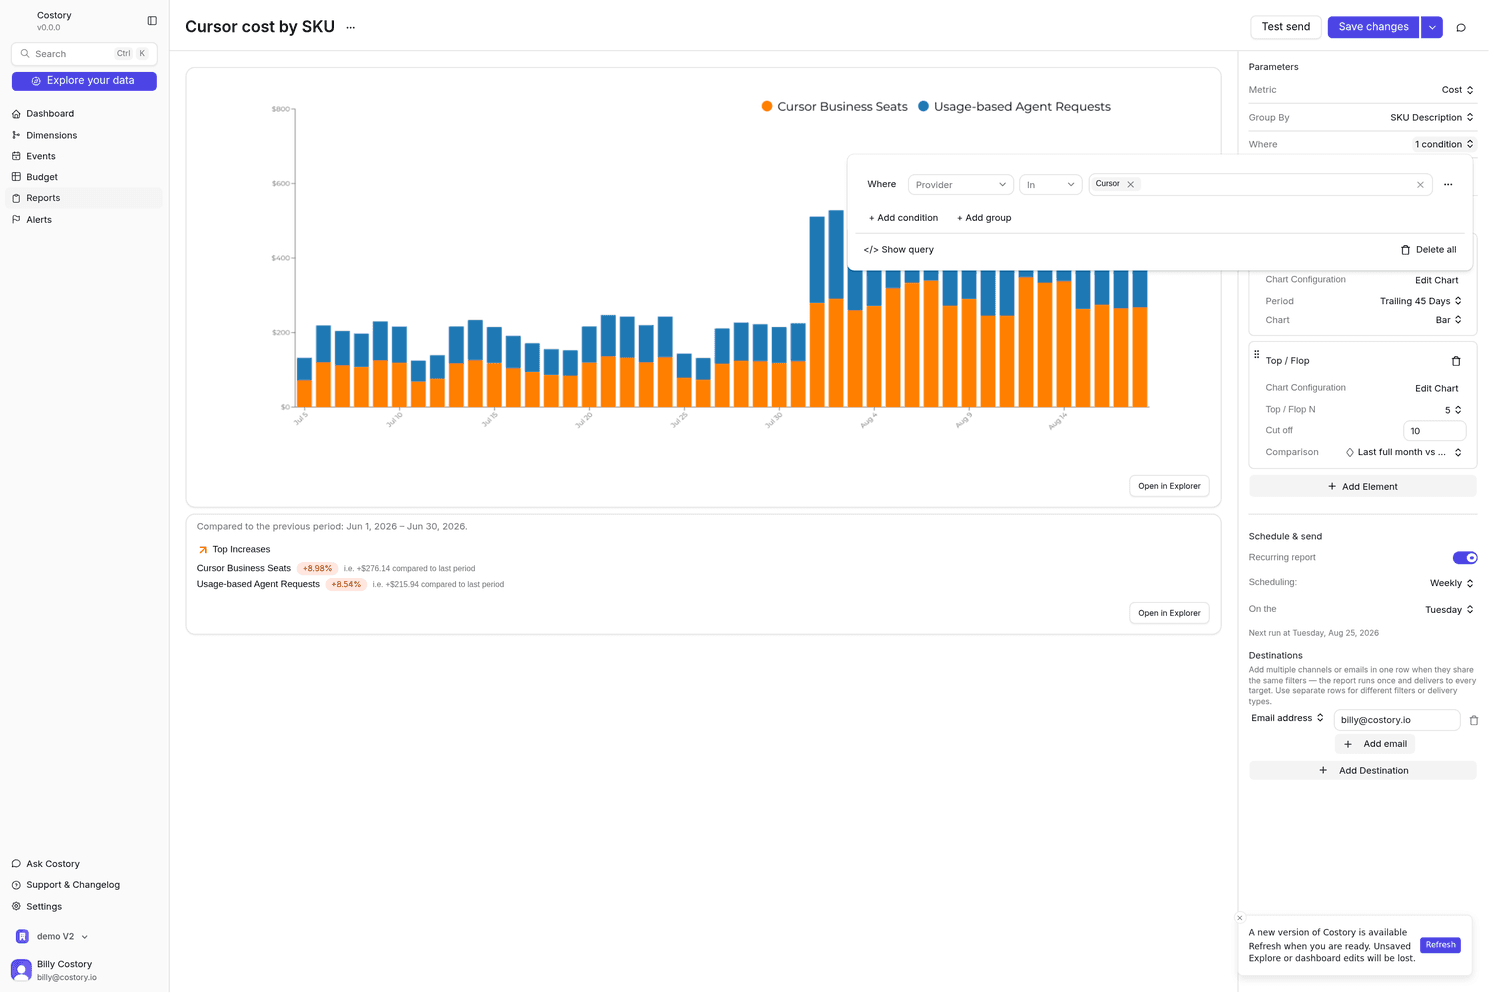
03 · WEEKLY ALERT
Alert if Cursor costs increase more than 10% over a week. Seat and license invoices are not in the usage stream — Costory is explicit about that. Reports go to Slack, Teams, or email.
WHAT YOU CAN ASK
“Which model name caused a cost increase this month?”
“Do my users use Max mode vs standard?”
“Which Cursor users spent the most on Grok this week?”
FAQ